Vocab
- Blended finance: is strategic use of developmental and additional Finance for SD.
- Ethical Wealth Creation
- Geospatial technology
- Gestation period
- Volatility
- Knowledge based economy
- Skill based economy
- Downward pressure
- Fiscal pressure
- exchange rate instability
- lack of access to credit
- fiscal consolidation
- ‘just in time’ to ‘just in case’ (supply chains resilience)
- Capex spending
- 11.1 % of Budget (3.4% GDP)
- Viability gap funding
- ESG Investing
- Core banking software (requirement for computerization)
- Increase Logistics competitiveness
- Coordinated and integrated logistics system
- Record GST collections
- Diversified economy
- ‘leave no one behind’ approach (Economic Survey)
Data
- PLFS - Worker/population ratio = 51.8%
- National Manufacturing Policy 2011 - 15 to 25% creating 100 million jobs
- 99% of 63 million MSME are in unorganized sector
- Total outstanding credit to MSMEs stood at Rs 22.6 trillion in 2022-23
VAM
- Economic Survey
- Get GDP Growth data
- YoY growth data
- Single window portal - Nivesh Mitra
- RBI’s financial stability report
Issues Related to
Planning
- Meaning of Planning
- planning refers to the strategic allocation of resources to achieve desired economic objectives.
- Need for Planning in Economic Development
- coordinated development
- addressing socio-economic disparities
- ensuring sustainable growth
- Imperative Vs. Indicative Vs. Structural Planning
- Objectives of Planning
- Indian Planning History
- Techniques of Indian Planning
- Sectoral Planning
- Regional Planning
- Achievements of Indian Planning
- Shortcomings of Planning in India
- Top-Down approach : Centralized Planning
- Limited People’s Participation:
- Insufficient Private Sector Involvement:
- Sectoral Imbalance
- Implementation
- Bureaucratic hurdles
- Corruption
- Inadequate monitoring and evaluation
- Socio-economic
- Poverty and Inequality
- Unemployment
- Agricultural distress like low productivity of farmers
- Urban-Rural Divide
- Health and Education
- Environmental Degradation
- NITI Aayog Vs. Planning Commission
- NITI Aayog - Providing strategic and technical advice to the Central and State governments.
- Determinants of potential GDP
- Human Capital: Skills, education, and health of the workforce.
- Physical Capital - machinery, equipment’s, industries
- Infrastructure
- Technology
- Natural Resources: minerals, water, and land resources
- Entrepreneurship and innovation
- Economic policies : Macroeconomic stability, fiscal policies, and trade policies.
- Good governance
- Looking Ahead
- Bottom-up approach : more decentralized and flexible planning process
- Data-Driven Planning
- Focus on achieving measurable outcomes
- Role of the Private Sector including investment, expertise and innovation.
- Conclusion
- Article 39 directs the state to ensure operation of economic system does not result in concentration of wealth.
Mobilization of Resources
- Introduction
- India needs 5T economy. -World Bank
- Types of Resources
- Natural - Natural Resources
- Human - Labour, Entrepreneurship, Capital (Skills, Knowledge, Experience, Capabilities)
- Financial - govt. revenue, foreign aid, private investment
- Physical capital - materials, equipment,
- Infrastructure, technology
- Social - social harmony
- Foreign resources - FDI, FII, ODA, remittance
- Information and data
- Institutional
- PPP
- Need for Resource Mobilisation
- Poverty alleviation
- Sustainable development
- Economic growth
- Role of Savings & Investment
- Capital Formation - Infrastructure, machinery, technology, human capital -> productive capacity
- Financial Stability - availability of credit, the stability of interest rates
- Innovation
- Long-Term Planning and Development - Infrastructure (TEC-CS)
- Economic Growth
- Job Creation
- Government Resources – Tax & Non-Tax (Fiscal & Monetary Policy)
- Issues
- Vertical fiscal imbalance (VFI) between the Union and State governments in India.
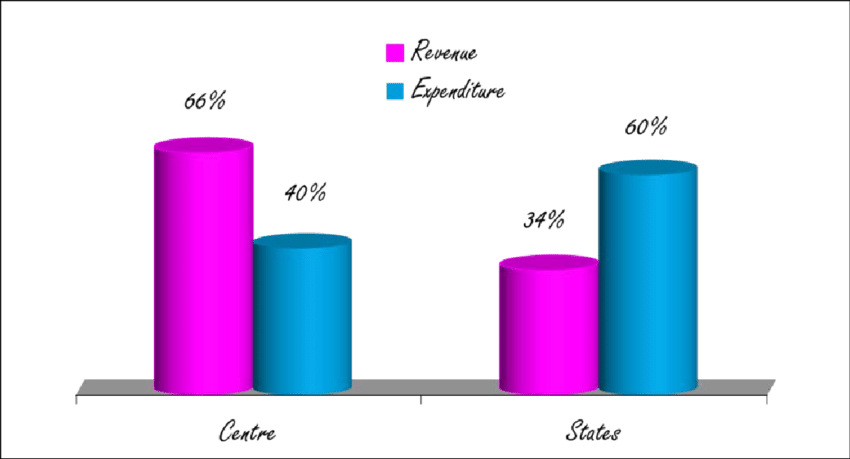
- Finance commission is responsible to correct this imbalance.
- Vertical fiscal imbalance (VFI) between the Union and State governments in India.
- Issues
- Banking Sector & NBFCs
- Capital Market
- External Sources – FDI, ODA etc.
- Public Borrowing & Management of Public Debt
- Challenges in Mobilising Resources for Development
- Fiscal deficit
- Aim to lower the fiscal deficit to 5.1% of GDP by FY25
- Inflation - demand pull and cost push
- Strategies for management -
- Monetary policy tools like adjusting repo and reverse repo rates
- Fiscal discipline
- Targeted subsidies and price control measures
- Addressing supply side bottlenecks like improving primary infrastructure, supply chains
- Strategies for management -
- Tax evasion
- Inclusive growth
- Balancing resource utilization with environmental conservation
- Addressing corruption and improving governance
- International cooperation
- Technological adaption
- Fiscal deficit
Growth
- Introduction
- India’s GDP is projected to grow at 7%.
- GDP is the market value of all final goods and services produced within an economy in a given period. The GDP data is calculated by National Statistical office (NSO).
- India’s GDP -
- Primary sector - 18% (agriculture, livestock, forestry, fishing)
- Industry - 29% (Manufacturing - 14%)
- Services - 54%
- Sectoral distribution
- Organized sector -
- 17% employment, 55% output
- unorganized sector -
- Employs 83% - 45% output (PLFS)
- Organized sector -
- Targets
- 7 Trillion by 2030
- Potential growth
- Potential growth refers to the maximum rate at which an economy can grow over a sustained period without triggering inflationary pressures.
- Determinants of Growth
- Human capital - LFPR, entrepreneurship, population growth, , skills, knowledge
- E.g. Israel
- Physical capital - infrastructure, machinery, and equipment
- GFCF - Gross Fixed Capital Formation/GDP - 29.2%
- Natural resources
- Human capital - LFPR, entrepreneurship, population growth, , skills, knowledge
FLAW-ME
- Russia
- Investment and savings
- ICOR - Incremental Capital-Output Ratio (7.5 in FY 12 is now only 3.5 in FY22)
- Availability of credit
- Technological progress
- USA
- Strong institutions, Good governance
- political stability, rule of law, property rights protection, and efficient regulatory frameworks
- UK
- Macroeconomic stability
- Price stability, Inflation(2-6 %), debt levels (83% of GDP)
- Tools - Fiscal and Monetary policies
- URJIT PATEL committee - Monetary Policy
- Trade and exports
- China
- Why growth driven by productivity
- Sectoral Shifts: services and manufacturing from agriculture
- Technological advancements and automation : IT sector growth
- Structural Reforms in Business Environment: LPG; GST, IBC, NPA resolution; e-governance
- Formalization of the Economy: digitization; UPI
- Digitalization : automated routine task
- Globalization : compelled to adopt global best practices
- Urbanization
- Better management practices :Efficient workflows, optimized processes, and improved resource allocation
- Manufacturing Efficiency : PLI Scheme
- Increased Capital Investment: complemented labor
- Innovation and R&D led to new products improving productivity of labour
- Human Capital Development : Skill India;
- Indicators of economic recovery
- Economic Growth
- Unemployment rates (CMIE - 7.3%)
- Consumer spending
- Business sentiment, Investment activities
- Industrial production and manufacturing output
- Trade and Export Performance
- Financial Markets
- Government Initiatives - infrastructure investments, tax reforms, and fiscal stimulus
- E.g. GST, corporate tax reforms etc.
- GDP
- Factors in Calculation
- Method
- Expenditure Method - CIG(M-x) - चिकजम
- Income Method - WIPR - विप्र
- Production method - GVA of all sectors
- Method
- Base Year - 2011-12
- Current calculation use GDP at Market Price
- Data Source : MCA21 database
- Price Index: use of CPI along with WPI
- Consumption expenditure using NSSO household consumption expenditure survey
- Factors in Calculation
- GDP deflator (= Nominal GDP/ Real GDP)
- GDP at Factor cost, Base Price, Market price.
- GDP क्या कैप्चर नहीं करती है? -
- Does not measure Standard of living and well being
- Inequalities in distribution - GINI index
- Unpaid works - Household by women
- Environmental Damages
- तो फिर कैसे नापे?
- Human development index
- Gross National Happiness Index
- Genuine Progress Indicator
- Environment adjusted GDP
- Advantages of steady GDP growth and low inflation
- Arguments
- Macroeconomic stability conducive to investment and development
- Consistent increase in FDI
- Improved Living Standards: increased consumption, poverty reduction, and a larger middle class.
- Reduction in poverty rates from 21.9% in 2011-12 to about 11.6% in 2022-23 [Niti Aayog]
- created job opportunities
- Increased government revenues facilitated greater public spending on capital formation and welfare programs
- lower interest rates simulate borrowing and investment
- Contribute to reduced fiscal deficit
- Macroeconomic stability conducive to investment and development
- Potential drawback
- Income Inequality
- Underemployment and low-paying jobs
- Sectoral concentration
- Rural-urban divide
- Environmental degradation
- Informalization and Contractualisation of work space
- Arguments
- Factors inhibiting economic growth | Challenges
- Human resources
- Skill Mismatch
- Low industry interface, insufficient training, (Skills India Report - 48% youth employable)
- Low female LFPR, unpaid work
- PLFS - 37%
- Male/female LFPR = 0.33 (ideally = 1)
- Underemployment in informal sector and agriculture
- Skill Mismatch
- Regulatory Burden
- Land and labour laws, bureaucratic red tape
- Infrastructure Bottlenecks - TEC-C-S
- E.g. logistic cost (India = 14%, USA = 8%)
- Informal Sector Dominance
- low productivity ( 83% employment -> 45% economic output)
- Inefficient Agricultural Sector:
- 14.2% GDP, 46% population
- Disguised unemployment, fragmented landholdings, poor actualization of ability
- Poverty and Income Inequality
- Top 1% owning 40% of the wealth in 2023.
- Jobless Growth
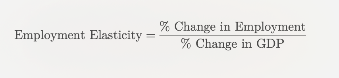
- Employment elasticity less then 0.1%
- Low R&D; technological development and innovation
- Limited Access to Credit for SMEs:
- Limited export orientation
- Environmental Degradation
- India ranked 168 out of 180 in the Environmental Performance Index.
- Human resources
- Limitations of Economic Growth
- Income Inequality
- Regional disparities
- Bihar’s per capita income is significantly lower than that of Maharashtra.
- Environmental concerns
- Degradation and pollution
- Climate change and biodiversity loss
- Social issues
- Job displacement
- Uncontrolled urbanization
- Sustainability concerns
- Over exploitation of resources
- Changing values system -
- Consumption-oriented lifestyles, neglect of social, cultural, and spiritual aspects of well-being.
- External risks
- market failures - e.g. 2008, 2020
- Way forward - inclusive, sustainable and equitable growth
- Enhancing Human Capital
- Infrastructure Investment and Capital formation
- 11.1% of Budget 2024
50000 crore - NRF
- Promoting Innovation and Research
- Addressing structural issues - GST; NPA problem; IBC; e-governance E.g. SWIFT Portal
- Export promotions -
RoDTEP; Export facilitation centre; SEZs
- Financial Inclusion - credit availability for marginalized sections
UPI; ULI; Mudra Loans
- Digital inclusion
- Digital India Mission
- Investing in Critical manufacturing
- Semicon India Programme - 76000 crore outlay
- Push for renewable energy
- Reducing Regional disparities
- E.g. region specific grant -15th finance commission
- Addressing sector specific stress
- Agriculture - food processing, farm equipment, affordable credit
- Manufacturing - labour intensive industries; PLI schemes
- Banks - NPA problem, strict oversight over lending etc.
- Sustainable Development - green economy
- Promoting Capital Expenditure
- 50-year interest-free loan to states
- PLI 2.0 for IT Hardware scheme
- Rs 17,000 crore budgetary outlay
- Conclusion
Development
- Meaning of Development
- Development refers to a process of positive and progressive change in various aspects of society, economy, and human well-being.
- According to PROF. AMARTYA SEN, Development is expanding people’s choices and capabilities including education, health, skills to live the kind of life they want to live.
- Difference between Development & Growth
- Growth is a measure of the increase in economic output, while Development is a broader measure of positive and progressive change in various aspects of society, economy, and human well-being.
- Growth is quantitative, value neutral
- Development means a qualitative change which is always value positive.
- Determinants of Development
- Human Capital : Education, Skill, Experience, Capabilities, Entrepreneurship
- Physical Capital : infrastructure, investment, credit, technology, industrialization IICT
- Social Factors : Unity, inclusivity, equity, social justice, gender equality
- Political Factors : Strong institutions, Good Governance , effective policies, political stability, rule of law
- Environmental Sustainability : Sustainable use, conservation, mitigation
- Technological : advanced technologies, digital inclusion, knowledge-based economy.
- India has 820M internet users which would reach almost a billion by 2025.
- Digital economy is 12% of GDP. Govt planning to increase it to 20% by 2026
- International Factors: FDI, technological transfers, trade and cooperation
- Measurement & Indicators of Development
- Gross Domestic Product (GDP)
- Human Development Index (HDI)
- Multidimensional Poverty Index (MPI)
- Gini coefficient
- Education Index - literacy rate, years in schooling
- Health Index - life expectancy, infant mortality rate, maternal mortality rate, and vaccination coverage.
- Gender Inequality index (UNDP)
- Infrastructure Indicators
- Global Environment Outlook, Emission Gap Report
- Approaches to Development:
- State led development Approach
- Market-Based Economic Growth Approach
- Sustainable Development Approach : integrates economic, social, and environmental dimensions of development.
- Participatory Development Approach
- Gender and Development Approach
- Human Development Approach : emphasis on expanding people’s capabilities and choices.
- Regional and Local Development Approach : context-specific strategies that consider local resources, culture, and socio-economic conditions.
- Sustainable development
- BRUNDTLAND COMMISSION REPORT ‘OUR COMMON FUTURE’ defines sustainable development as a “development that meets the needs of the present without compromising the ability of future generations to meet their own needs.”
Employment
- As per the Periodic Labour Force Survey, about 83% of jobs are informal.
- India’s GDP has grown at an CAGR of around 7%, but the job growth has been close to 1%.
- India’s labour productivity in manufacturing is less than 10% of OCED and 40% of china- World Bank
- As per PLFS - LFPR - 57.9 (Male – 78.5% & Female – 37%) in 2022-23
- Unemployment refers to the state of being without a job and actively seeking employment.
- Indian economy need to generate 78 lakh jobs each year till 2030 in non farm sector [ES 2023-24]
- Data
- Current unemployment rate - 3.2% (PLFS 2023)
- LFPR (PLFS) - 57.9 (Male – 78.5% & Female – 41%) in FY 2022-23
- Gender pay gap - 50% in informal sector. 19% in formal sector
- The India Employment Report 2024, by ILO
- youth constitute nearly 83% of the unemployed workforce.
- Nature – Rural vs. Urban, Formal Vs. Informal
- Terms Related to Employment –
- Labour Force Participation Rate
- Unemployment Rate
- Working Age Population
- Employment elasticity
- Current methodology to calculate unemployment
- Periodic Labour Force Survey (PLFS) by NSO
- Usual Status Approach
- Current Weekly Status (CWS) Approach
- Current Daily Status (CDS) Approach
- Employment-Unemployment Surveys (EUS)
- Labour Bureau Survey
- Private Sector Surveys: Conducted by organizations like CMIE
- Improvement -
- Increase the frequency of surveys
- Incorporate gig and informal workers
- Include metrics for skill mismatches
- Detailed regional data at state and district level
- Real-time data collection through mobile platforms
- Conduct longitudinal studies to track employment trends over time
- We need to employ comprehensive methodologies to gauge structural unemployment and do targeted intervention for promoting inclusive growth.
- Periodic Labour Force Survey (PLFS) by NSO
- Sectoral Distribution of Employment
- Quality of Employment
- Causes of Lack of Employment
- Care economy : housekeeping, caregiving, etc.
- Produces non-monetary value
- 19% of GDP of India if monetized (ILO)
- cooking, housekeeping, caregiving for children or elderly
- Associated with traditional gender roles
- Women spent 350 minute/day on unpaid care work [NSSO]
- Involves emotional support and nurturing
- Not accounted in GDP
- Essential for maintaining social fabric and childcare
- Limits women’s participation in formal employment and education
- Produces non-monetary value
- Restructuring of Workforce
- Skill development; digital literacy; entrepreneurship; agriculture to agribusiness transition; manufacturing; promoting industry 4.0; universal basic income
- Impact of globalization
- Positive
- Increased trade, foreign direct investment, and technological advancement
- Negative
- Competition from imports - protected sector got downsized
- Shift in manufacturing locations : e.g. China, Vietnam
- Impact on traditional industries : textile and handicraft got informalized
- Positive
- Issues related to employment
- Skill mismatch
- Lack of female participation
- PLFS - male/female LFPR - 0.33 (Ideally 1)
- Male LFPR: 78%
- Female LFPR: 37%
- Contribution of women in Indian GDP: 17% ; world avg is 37%
- PLFS - male/female LFPR - 0.33 (Ideally 1)
- Informal sector dominance
- 83% of workforce that account for 45% of the GDP.
- E.g. textile industry, traditional artisans, shops etc.
- Underemployment
- Labour productivity - 10% OECD, 40% China
- High Agricultural Dependency
- Urban-Rural Employment Gap:
- Technological disruption e.g. robots, computers led to automation and job displacement
- 40% of Indian employees will need reskilling and 60% will need to upskill to be market-ready.
- Voluntary unemployment for better opportunities
- Worker Population Ratio (WPR):
- Male - 69.8% (Q1 2024 PLFS)
- Female - 23.4% (Q1 2024 PLFS)
- Capital-intensive industries e.g. Oil refineries, steel production, automobiles etc.
- Failed to move disguised employed out of primary sector
- Lack of export orientation
- India accounts for only 2.4% of world exports - ES 19-20 .(China 13% USA 9%)
- Government policies - WTO norms
- Dwarfing of MSME’s
- An average enterprise has only 2.24 employees
- Number of MSME - 6.33 crore
- Employed by MSME - 20 crore
- MSMEs contribute about 30 % to GDP and 45.7% to exports (Economic Survey 2023-24)
- Problems
- only 16% of MSMEs have access to formal credit [RBI]
- An average enterprise has only 2.24 employees
- Initiatives for MSME
- Raising and Accelerating MSME Performance (RAMP)
- MSE GIFT Scheme (MSME Green Investment and Financing for Transformation Scheme)
- MSE SPICE Scheme (MSE Scheme for Promotion and Investment in Circular Economy)
- Emergency Credit Line Guarantee Scheme (ECLGS)
- CREDIT GUARANTEE SCHEME FOR MICRO AND SMALL ENTERPRISES (CGMSE)
- Udyam Registration portal
- MSME Export Promotion Council
- MSME industrial parks
- Innovative mechanisms (UK Sinha committee)
- grievance redressal mechanisms (Samadhan Portal, CHAMPIONS Portal).
- Raising and Accelerating MSME Performance (RAMP)
- Forward and backward linkages between agriculture, Industries and services.
- Lack of skills, healthcare, tax incentives, governance issues (license raj)
- Only half of youth employable- India skills report.
- Only about 5% of workforce formally skilled (52% USA; 92% South Korea)
- Labour law complexities
- Code on Wages
- Code on Social Security
- Industrial Relations Code
- Occupational Safety, Health and Working Condition Code
- STEPs to boost manufacturing
- Reducing regulatory burden : labour law reforms
- Ease of Doing Business Reforms : DPIIT single-window clearances
- E.g. SWIFT, NeGP 2.0, Udhyam Registration Portal
- Develop Industrial Corridors; Logistics, Transportation, power supply
- Make in India Initiative
- Production Linked Incentive (PLI) Scheme : food processing, electronics, pharmaceuticals, and automotive sectors
- Micro and Small Enterprises - Cluster Development Programme (MSE-CDP)
- Skill India Mission, PMKVY
- Technology adaption and digitalization; R&D Incentives
- Exports promotion : RoDTEP
- Pivot to Green Manufacturing : EV; Solar Panels; wind turbines
- FDI, Special Economic Zones (SEZs); Supply chain resilience
- International cooperation : Japan-India manufacturing centers
- Measures
- Skill development and vocational training
- National Skill Development Mission - target to train 400 million
- Skill India, NEP 2020, PM DAKSH, PM KVY, Digi Saksham Scheme
- PMKVY 3.0, 7.4 lakh persons have been trained, 66% certified and 41,437 placed
- Jan Shikshan Sansthan (JSS) Scheme: vocational training to non- literates and school dropouts
- National Apprenticeship Promotion Scheme
- Craftsmen Training Scheme
- SANKALP, SMART, NIPUN, STRIVE
- Women participation
- E.g. STEP Scheme
- Labour market reforms : simplifying labour laws and promoting ease of doing business
- Promotion of Small and Medium Enterprises (SMEs)
- MUDRA loans to help expand and create jobs
- PM SVANidhi Scheme
- Public Employment Programs
- MGNREGA
- Rozgar mela - 1 Million jobs/yr. in government
- Institutional support - PLI schemes, Industrial Policy
- Manufacturing target 25% GDP and 100 million job generation by 2030
- PLI Schemes outlay of Rs. 1.97 lakh crore
- ATMANIRBHAR BHARAT ROZGAR YOJANA (ABRY)
- To create new jobs in the formal sector
- Gig Economy
- Potential to add 2 crore jobs and 1.25% to India’s GDP by 2028 (NASSCOM)
- E.g. uber drivers; freelance professionals like designers, writers and programmers; airbnb homeowners
- PM VISHWAKARMA SCHEME
- for traditional artisans and craftspeople
- Atmanirbhar Bharat Rojgar Yojana (ABRY)
- DAY-NRLM
- National Career Service (NCS) Project:
- Financial inclusion
- PM SVANidhi Loans
- PM Street Vendors AtmaNirbhar Nidhi
- Pradhan Mantri Mudra Yojana (PMMY)
- PM SVANidhi Loans
- Labour-intensive industries
- Leather, apparels, textile, manufacturing, chemicals, food processing, tourism.
- E.g. PM-MITRA scheme
- E.g. PLI for technical textile.
- Leather, apparels, textile, manufacturing, chemicals, food processing, tourism.
- Investment in infrastructure
- Construction of labour-intensive civil works
- Bharatmala Pariyojana
- PM GatiShakti
- Promote entrepreneurship
- Startup India, standup India
- Cluster development - SEZ’s, MSME Clusters, Industrial corridors.
- Make in India
- Agriculture sector
- Increasing cropping intensity - rural employment, food security
- Irrigation projects, land development programmes, afforestation, grassland development and creation of basic rural infrastructure, such as electricity, roads, market, credit and services.
- Food processing
- Skill development and vocational training
- Conclusion
- $5 Trillion Economy , आत्म निर्भर भारत
- Article 43A encourages the workers participation in management of industries.
Inclusive Growth & Issues Arising From It
(<> trickle down approach)
-
Introduction
- As per OCED inclusive growth is economic growth that is distributed fairly and creates opportunities for all.
-
Elements of Inclusive Growth - PSSE
- distribution and fairness of the economic benefits

-
Indicators of Inclusive Growth
- Poverty and inequality measures
- Poverty rate, Gini coefficient
- The top 10% have 80% national wealth
- 11% people below poverty line
- World Inequality lab - 1% holds 22.6% of National Income and 40% of National Wealth
- MGNREGA
- Poverty rate, Gini coefficient
- Access to basic services - education, healthcare, clean water, sanitation, housing
- literacy rate (77%)
- ASER highlight 44% of grade 5 students in rural India could read a grade 2-level text.
- Only about 3% on education
- school enrolment rates (98%)
- access to healthcare facilities (30000 PHC)
- Only about 1.28% of its GDP on healthcare
- literacy rate (77%)
- Social security coverage -
- Social security schemes, health insurance, and targeted welfare programs.
- PRADHAN MANTRI SHRAM YOGI MAAN DHAN (PM-SYM)
- Social Security to unorganized sector employees
- Human development indicators
- Financial inclusion
- E.g. जन धन Scheme
- Social cohesion indicators
- Social and Political Stability
- Employment and Labour force participation rate
- Poverty and inequality measures
-
Indicators of sustainable growth
- Environmental Protection : EIA, CAMPA
- Resource Efficiency : NMEEE
- Renewable Energy : National Solar Mission
- Climate Change Mitigation: National Action Plan on Climate Change
- Sustainable Agriculture:
- Urban Sustainability : Smart Cities Mission
- Biodiversity Conservation : Wildlife Protection Act
- Sustainable Economic Policies: Fiscal Responsibility and Budget Management (FRBM) Act
-
Issues and Challenges in achieving inclusive growth
- Income inequality
- Oxfam - ‘Survival of the Richest’ - 2023
- Oxfam India Highlighted top 10% of India hold 80% of the Total National Wealth.
- Bottom 50% just hold 3% of wealth.
- Oxfam - ‘Survival of the Richest’ - 2023
- Access to education and healthcare
- Unemployment and underemployment
- 8.1% in April 2024
- Balancing growth and equity
- Debt burden due to welfare policies
- Balancing development and conservation
- Regional disparities
- States like Bihar, Uttar Pradesh far behind Kerela and Tamil Nadu
- Rural-urban divide
- Digital divide
- Lack of financial inclusion
- Gender divide
- only about 37% of women being part of the labour force compared with 78% men
- E.g. Sayyid Hamid Committee - skilling women at preference
- Caste-based discrimination continues
- Governance and Corruption:
- Informal sector
- Infrastructure Gap
- Targeting the right beneficiaries : inclusion and exclusion errors
- Political will
- Low Insurance penetration
- 4.2% (IRDAI)
- Income inequality
-
Challenges in meeting the objectives of inclusiveness and sustainability together
- Growth vs. Equity
- Development vs. Conservation
- Ensuring environmentally sustainable infrastructure development
- Social inequalities
- Financial constraints
- Technological barriers
- High initial cost, import dependency and lack of training and capacity
- Securing adequate funding while meeting sustainability
- large-scale renewable energy projects
- Solutions
- Integrated planning : ESG frameworks; Strategic Environmental Assessments (SEAs)
- Sustainable Financing : green bonds; social stock exchange
- Local capacity building
- Innovative technology
-
Significance for Inclusive Growth
-
How financial inclusion helps in inclusive growth
- Encourages savings that lead to higher investments
- Access to credit enables small business to operate
- Financial services facilitate direct benefit transfer to reduce risks and poverty
- Bringing more people into the formal financial system enable businesses and entrepreneurs
- Financial literacy increase economic participation
-
Recommendations for Inclusive growth
- Investment in Human Capital : quality education, healthcare, vocational training
- The Skill India initiative
- National Education Policy (NEP) 2020
- The Ayushman Bharat scheme - healthcare coverage to over 100 million families
- Gender equality
- The Beti Bachao Beti Padhao scheme
- Social inclusion
- Reservation for SC, ST, OBC, EWS
- Infrastructure Development
- E.g. Gatishakti masterplan
- Social Safety Nets like minimum wage, unemployment benefits
- Public Distribution System (PDS) and MGNREGA
- Supporting micro, small and medium enterprises (MSMEs)
- Inclusive Digitalization
- Agricultural Reforms
- Green Economy
- Promoting renewable energy, sustainable agriculture
- Labour Market Reform
- Promoting labor-intensive industries
- Financial Inclusion : bank account and access to affordable credit for all
- The Pradhan Mantri Jan Dhan Yojana
- Progressive tax system and fair regulations
- Good governance
- Technology and innovation
- Support entrepreneurship
- e.g. Startup India, Standup India
- Sectoral Diversification:
- Inclusive Business Models: Corporate Social Responsibility (CSR)
- Public-Private Partnerships (PPPs):
- Community Participation: empowering PRI and municipalities
- Investment in Human Capital : quality education, healthcare, vocational training
-
Conclusion
- ‘growth without inclusion is meaningless, inclusion without growth is unsustainable’
- Article 39 directs the state to make provisions for distribution of resources as best to subserve the common good.
-
Status of digital economy
- Internet penetration : over 850 million internet users as of June 2024
- Digital Payment : UPI processing over 13 billion transactions monthly.
- E-Governance : NeGP 2.0, JAM, MyGov App, DBT transfers
- Digital Literacy : PMGDISHA target to make 60 million rural households digitally literate.
- E-Commerce : market size expected to reach $200 billion by 2026.
- Digital Health : Ayushman Bharat Digital Mission (ABDM)
- Digital Education : DIKSHA portal
- Start-Up Ecosystem : third largest globally with over 100 unicorns as of May 2024.
-
Problems
- Digital Divide : Rural internet penetration stands at around 44% compared to urban at 75%. [NFHS-5]
- Cybersecurity Threats : 37% rise in cyberattacks in 2023 [CERT-In Report]
- Digital Illiteracy : Only 38% of the rural population has basic digital skills
- Infrastructure shortage : stable broadband and electricity connection
- Regulatory Challenge : Data localization and privacy laws
- Affordability Issue : especially for people from lower socio-economic strata
-
V shaped recovery arguments in support
- Rapid GDP Growth : after contraction of 7.3% in FY 2020-21. Rebounded with 8.7% in FY 2021-2022
- Surge in industrial production : Economic Survey 2023-24 showed robust industrial growth of 9.5%
- Strong Export Performance : exports crossed the USD 778 billion mark in FY 2023-24
- Revival in Consumption : pent-up demand led to surge in consumer spendings
- Government Stimulus
- Stock Market rebound
- Reduced Unemployment : CMIE data indicates unemployment at around 3.1% in 2023.
-
Counterarguments
- Sectoral Disparities : informal sector still struggling to fully recover
- Uneven Recovery :
- Rural Distress
- Supply Chain Disruptions
- High fiscal deficits and corporate debt levels
- Healthcare and education setbacks
-
Inter-generation equity challenges
- Environmental degradation
- High public debt
- Food security
- Climate change vulnerabilities
- Biodiversity loss
- Threat to traditional knowledge and cultural heritage
Government Budgeting
- The budget of a government, as per Article 112 is a Annual Financial Statement that outlines its anticipated revenue and expenditure for that year.
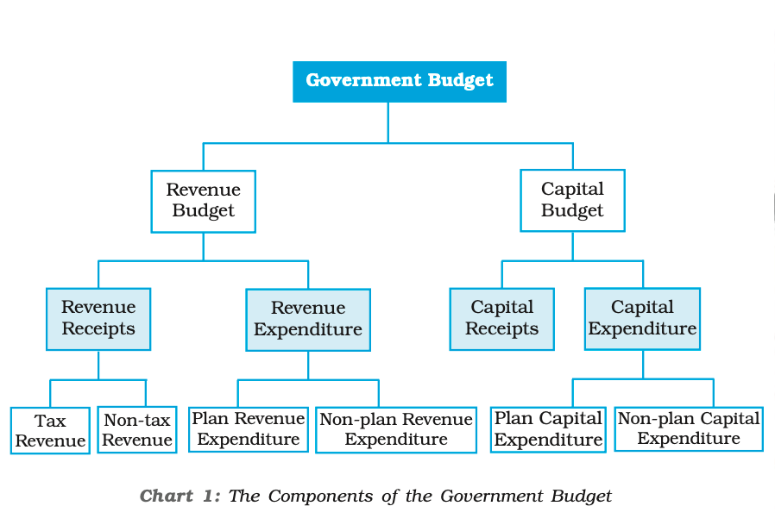
- Capital budget
- Receipts
- Loans from citizens
- Loans and aid received from foreign entities
- Proceeds from disinvestment
- Recoveries of loans extended by government to states, UT or other entities
- Expenditure
- Repayment of principal amounts of the government’s borrowings
- Acquisition of Assets
- Development Projects
- Loans given to states, union territories, and other entities.
- Receipts
- Revenue budget
- Receipts
- Tax Revenues:
- Receipts
Example: Income tax, corporate tax, GST, customs duties.
-
-
- Non-Tax Revenues:
-
Dividends, fees, fines and interest on loans extended by government
-
-
- Expenditure - Salaries and pensions to government employees and retirees - Subsidies : food, fertilizers, and fuel. - Interest Payments on government borrowing - Grants and aid given to states, UT and others - Administrative expense of running government departments
-
- This statement evidences the receipts and expenditure of the Government in three separate parts under which accounts are maintained i.e. the Consolidated Fund (Article 266), Contingency Fund (Article 267) and Public Account (Article 266).
- Need for Government Budgeting
- Government expenditure
- Taxes it plans to levy
- Other provisions
- Components of the Government Budget
(i) The Medium-Term Fiscal Policy Statement;
(ii) The Fiscal Policy Strategy Statement;
(iii) The Macro Economic Framework Statement.
- Changes in Budgetary Process
- Presentation of Budget.
- General discussion.
- Scrutiny by Departmental Committees.
- Voting on Demands for Grants.
- Passing an Appropriation Bill.
- Passing of Finance Bill.
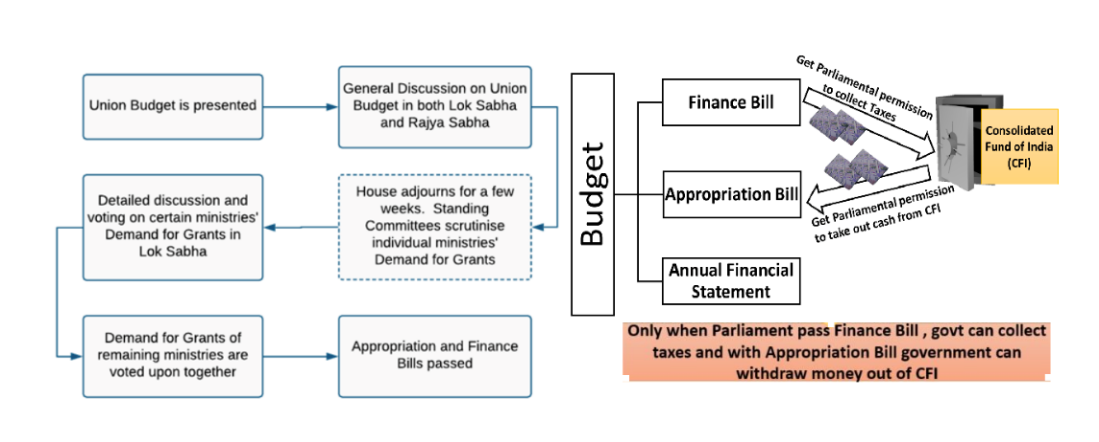
- Challenges in public budgeting
- Low tax-to-GDP ratio
- 11.1% (OECD - 34%)
- Shrinking fiscal space - populist and welfare policies
- 83% debt level
- Persistent revenue deficits
- Because of high expenditure on subsidies and welfare program
- High cost of interest payments
- About 25% budgetary allocation for interest payments
- Increasing demands of spending on health, education and social security needs
- New complexities like climate change, pandemics, and cyber security, disrupting technologies emerging
- Inadequate parliamentary oversight
- PAC has limited role of post-facto analysis
- Implementation Efficiency
- delays, cost overruns, corruption, and bureaucratic inefficiencies
- transparency, accountability
- Global uncertainties
- E.g. Supply chains, price fluctuation, trade wars etc.
- 2008 GFC, COVID-19
- Governance and Institutional Capacity:
- Lack of data driven governance
- lack of coordination among government agencies
- inadequate human resources
- Regional Imbalance
- NPA Stress
- Low tax-to-GDP ratio
- Measures of Government Deficit
- Revenue Deficit
- Fiscal Deficit
- Primary Deficit
- Fiscal Policy
- Deficit Reduction
- FRBM Act
- Other Types of Budgets – Outcome, Zero-Based, etc.
- Recommendations
- Long-Term Planning and : Developed India 2047
- Fiscal sustainability : adhere to FRBM targets
- Efficient Resource Allocation
- Increasing healthcare expenditure to at least 2%, education to 6% of GDP
- Performance-Based Budgeting
- Taxation reforms - broadening tax base, reduce tax loopholes, ensure fair, efficient and progressive taxation system
- GST
- Leveraging technology for budgeting, procurement, and monitoring
- Program Evaluation
- Improving budgeting process through public participation
- Adopting the Open Budget Index methodology
- Deepening of Fiscal Federalism
- Streamlining subsidies and targeting them effectively
- Government Initiatives
- FRBM Review committee (NK Singh)
- Fiscal deficit target in goldilocks zone - 2.5%
- Debt to GDP ratio - 60% (current 87%)
- Centre - 40% (current 58%)
- State - 20% (current - 29.5%)
- Monetary policy framework - Independent monetary policy
- URJIT PATEL committee
- FRBM Review committee (NK Singh)
- Conclusion
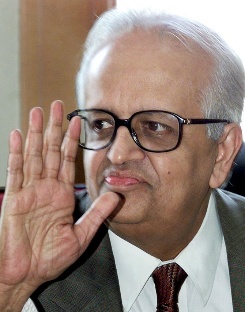
- BIMAL JALAN committee recommendation on expenditure management, rationalizing subsides, strategic disinvestment are implemented to realize growth potential.
- BIMAL JALAN committee recommendation on expenditure management, rationalizing subsides, strategic disinvestment are implemented to realize growth potential.
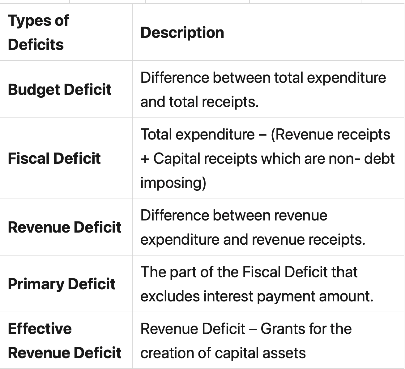
Budget 2023-24
- As per the ‘Saptarishi’ targets, the schemes have been divided into 7 Key Priority Areas
- YRF-UGII
- Inclusive Development
- Digital public infrastructure for agriculture
- Women’s small saving schemes
- Global hub for millets - Shree Anna
- 9000 crore credit guarantee for MSME
- Reaching the Last Mile
- Aspirational Block Programme
- Eklavya Model Residential Schools
- PM Aawas Yojana - 79000 crore outlay
- Jal Jeewan mission
- Infrastructure and Investment
- Digital public infrastructure for agriculture
- Urban infrastructure development fund
- 10 lakh crore outlay
- Vibrant village program
- 2.4 lakh crore for railway
- Unleashing the Potential
- National Data Governance Policy
- Make AI in India
- 3 centres of Excellence for AI
- PM VIKAS
- Green Growth
- Green Credit Programme - 35000 cr for energy transition
- MISHTI: ‘Mangrove Initiative for Shoreline Habitats & Tangible Incomes’ (MGNREGS + CAMPA)
- PM-PRANAM (promote alternate fertilizers and balanced use of chemical fertilizers)
- GOBARdhan scheme - waste to wealth plants
- Amrit Dharohar - wetlands
- Youth Power
- Pradhan Mantri Kaushal Vikas Yojana 4.0
- Agri accelerator fund
- National apprentice initiative
- Financial Sector
- Significant compression in subsidies
- Reducing personal income tax - up to 7 lakh no IT
- Observations
- Targeting for fiscal and debt consolidation - 6.4 % FD 2023 -> 5.9% 2024 -> 4.5 % 2025 (goldilocks consolidation)
- Sharp increase in capital expenditure with intent to ‘crowd in’ private investment in infrastructure - 4.5% of GDP
- Subsidies and funding for welfare scheme have been reduced steeply
- Due to decrease in the number of beneficiaries
- 50 years interest free loans to states for capital expenditure
- National financial information registry
- Mahila samman bachat patra (7.5% interest, 2L deposit, 2 year time)
- Government initiatives to improve quality of life
Budget 2024-25
- Nine Budget Priorities in pursuit of ‘Viksit Bharat’: MINIATURE
- Productivity and resilience in Agriculture
- Transforming agriculture research
- National Corporation policy
- Employment & Skilling
- 3 Schemes for Employment Linked Incentives
- First Timers
- Job Creation in Manufacturing
- Support to employers
- Model Skill Loan Scheme
- 3 Schemes for Employment Linked Incentives
- Inclusive Human Resource Development and Social Justice
- Purvodaya
- Pradhan Mantri Janjatiya Unnat Gram Abhiyan
- Manufacturing & Services
- Credit Guarantee Scheme for MSME
- Mudra Loans
- E-Commerce export hubs
- Critical Mineral Mission
- Urban Development
- PM Awas Yojna 2.0 - investment of 10 lakh crore
- Energy Security R&D of Bharat Small Modular Reactor
- Infrastructure
- 3.4 % of GDP for capital expenditure
- Innovation, Research & Development and
- Anusandhan National Research Funds
- Next Generation Reforms
- Bhu-Aadhaar for all lands (ULPIN)
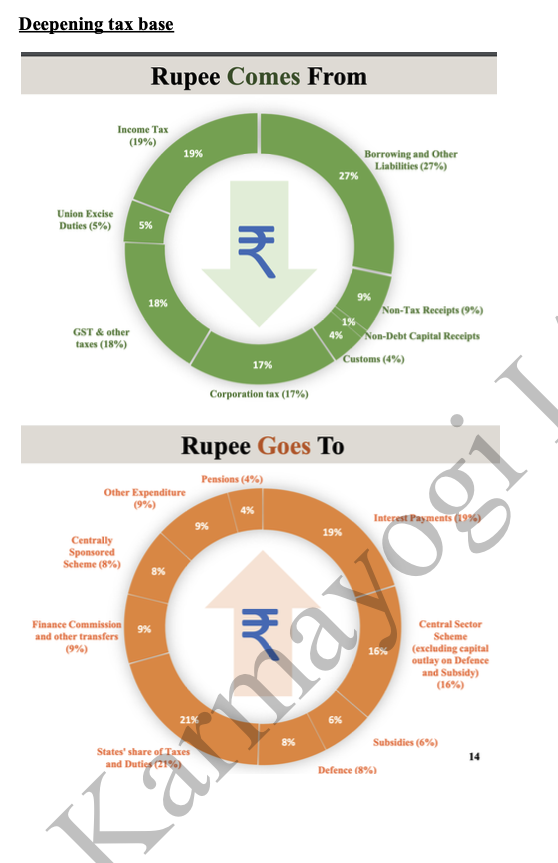
- Bhu-Aadhaar for all lands (ULPIN)
Effects of Liberalization on the Economy
- Liberalization refers to the removal of government controls and restrictions in an economy to encourage the free flow of goods, services, and capital.
- GDP in 1991 - 5.8 billion
- GDP today - USD 3.42 trillion, forex - $670.86 billion as of July
- Positive Impacts:
- Higher economic growth
- Example: India’s GDP growth rate increased from 1.1% in 1991 to over 6% in the 2000s.
- Attracted foreign direct investment (FDI) : led to modernization, technological advancements, and job creation.
- FDI inflows reached 129 million in 1991.
- Industrial development
- Example: The IT and software services sector flourished
- Boosted exports:
- Example: India’s total trade (exports + imports) as a percentage of GDP increased from 15% in 1991 to over 40% by 2020.
- $776.7 billion in FY 2023-24
- Example: India’s total trade (exports + imports) as a percentage of GDP increased from 15% in 1991 to over 40% by 2020.
- Financial Sector Reforms
- Example: The establishment of private sector bank like HDFC and capital markets like NSE
- Increased competition : improved efficiency and wider variety of goods and services
- Example: The telecommunications revolution post-1991, with mobile phone penetration skyrocketing.
- Entrepreneurship and Innovation
- Example: The emergence of start-ups like Flipkart and Paytm
- Poverty reduction
- Increased technology infusion : collaborations, joint ventures, and technology transfers
- Higher economic growth
- Negative Impact
- Income inequality
- Unemployment and informalization of jobs
- Sectoral imbalance : agriculture lagged behind
- Agriculture’s share in GDP has declined to around 17%, while employing over 50% of the population.
- Social issues: slums, pollution, and strain on infrastructure due to urbanization and rapid growth.
- Environmental concerns
- several Indian cities ranking among the most polluted globally.
- Vulnerability to Global Shocks
- Example: The global financial crisis of 2008 and the COVID-19 pandemic
- Regional Disparities
- Dimensions of Indian Economy
- Agriculture
- Industry
- Manufacturing
- Infrastructure
- Services
- Employment
- Foreign trade
- Liberalisation
- Deregulation of Industrial Sector
- Financial Sector Reforms
- Tax Reforms
- Foreign Exchange Reforms
- Trade and Investment Policy Reforms
- Privatization means shedding the ownership or management of a government owned enterprise.
- Disinvestment is selling off part of equity of PSEs to the public
Changes In Industrial Policy & their Effects on Industrial Growth
- Introduction
- Industrial policy refers to strategic efforts by the government to encourage the development and growth of specific sectors and industries.
- India’s GDP has grown at an average of around 7% since 1991, but the industrial output is underperforming at around 3-4%. ( Index of industrial production(IIP))
- Industrial Policy Before 1991
- Industrial Policy After 1991
- Abolition of industrial licensing
- Example: The Industrial Policy of 1991 abolished the License Raj
- Free entry to foreign technology
- Foreign investment policy
- Example: Allowing 100% FDI in sectors like telecommunications and single-brand retail.
- Access to capital market
- open trade
- abolition of phased manufacturing programme
- liberalised industrial location programme.
- Special Economic Zones (SEZs) to spur industrial activity and exports
- Make in India Initiative
- Example: Promoting sectors like automobiles, textiles, and electronics
- Micro, Small, and Medium Enterprises (MSME) Support:
- MUDRA loans, Standup India
- Infrastructure Development
- Example: Gatishakti Masterplan
- Innovation and Technology
- Technology parks and innovation hubs in Bengaluru, Hyderabad
- Abolition of industrial licensing
- Reasons for slow Industrial growth
- Complex regulatory environment
- Inadequate infrastructure - transportation networks, power shortages, and inadequate logistics facilities
- Informal sector dominance
- inadequate skill development : low productivity
- Policy constraints : Lack of policy clarity, inconsistencies, and delays in decision-making.
- limited access to finance
- bureaucratic hurdles
- Limited adoption of new technologies
- Complex tax structures
- Tax evasions
- India losing $15B - Tax justice report
- Lack of research and development
- E.g. only 0.5% GDP spend (China - 2.1%, USA - 2.5%, Israel - 6%)
- Niti Aayog recommendations - Increase GDER&D (gross domestic expenditure on R&D) to 2% of GDP.
- Effects of Industrial Growth
- Increased Industrial Output
- Example: India’s industrial output grew by 4% annually during the 1990s post-reforms.
- Boost in Exports
- Example: Exports from SEZs accounted for 30% of India’s total exports by 2020.
- Job creation primarily in service and manufacturing sectors
- Increased FDI Inflows
- Technological Advancement
- The IT sector become global leader in software services
- Increased Industrial Output
- Phases of Industrial Growth
- Linkage Between Economic Reforms and Economic Outcomes
- Weaknesses and Failures of Industrial Policies
- Government Initiatives
- National Manufacturing Policy
- SEZs
- Make in India
- Measures for bringing industrial growth
- Ease of doing business reforms : digitizing processes, online platforms
- E.g. SWIFT, NeGP 2.0, Udhyam Registration Portal
- Infrastructure development: -
- dedicated freight corridors, Smart Cities Mission, Gatishakti, Bharatmala
- Skill development and innovation : Skill India Mission and
- Research and development : Atal Innovation Mission
- Sector-specific policies : PLI, export promotion schemes, technology upgradation program.
- Niryat Bandhu Scheme (NBS)
- RoDTEP Scheme (Remission of Duties and Taxes on Export Products (RoDTEP) scheme)
- Currently Exports are around 22% of GDP (World Bank)
- SEIS Scheme
- Production Linked Incentive (PLI) 2.0 for IT Hardware
- New Foreign Trade Policy 2023
- Promoting diverse FDI
- $100 Billion (44% computer software and hardware)
- Labour intensive industries
- Forward and backward integrations in value chains
- E.g. food processing, renewable energy
- Semicon India Programme
- Design Linked Incentive Scheme for Semiconductors
- Ease of doing business reforms : digitizing processes, online platforms
- Insurance sector
- Bima Trinity
- Bima Sugam : one-stop shop for customers
- Bima Vistar : bundled risk cover for life, health, property and accidents
- Bima Vahaks (carriers) : Women-centric workforce
- Bima Trinity
- Factors responsible for the location of primary, secondary, and tertiary
Infrastructure
- Introduction
- Economic Survey - 5 Trillion
- World bank report on Financing India’s infrastructure needs
- Boost annual investment in city infrastructure by 400% over next 15 yrs. to meet it’s needs.
- Recent Data from Ministry of Finance Highlights that Gross fixed capital formation has risen to all time high, standing at 34% percent of GDP.
- Infrastructure in economy
- Connectivity : roads, railways, waterways, ports, and airports
- Logistics and transportation
- World Bank logistics performance index - India 44th
- E-log : grievance redressal mechanism
- Power supply :
- Industrial parks and zones
- Communication networks:
- Research and development facilities : Laboratories, testing facilities, innovation centres, and technology parks.
- Support industry-academia collaborations, promote innovation-driven industries
- Increase the productivity of FOP
- Infrastructure provides supporting services to main areas of industrial and agricultural production
- Stimulating economic activity
- Issues
- Financing Issues: High capital requirements and long gestation periods
- Regulatory Hurdles: Complex regulations and bureaucratic red tape
- Example: Land acquisition and environmental clearances
- Implementation Delays: Inefficient project management and coordination issues
- Example: Projects like Mumbai-Ahmedabad Metro faced significant delays
- Poor maintenance and upgradation
- Regional disparities
- Limited Private Sector Participation
- PPP models have not achieved expected scale of private sector involvement
- Role of Infrastructure in inclusive growth
- Stimulates economic growth by increasing connectivity and attracting investments
- Bharatmala Pariyojana aims to construct 34,800 km of road
- Employment generation
- E.g. - Bharatmala project - 15 crore man days of job
- Poverty reduction
- E.g. 5-10 time faster then subsidies
- Improving Quality of Life
- By providing access to healthcare, education, water and sanitation
- Jal Jeevan Mission provided tap connections to 11 crore households
- Digital Infrastructure support digital economy and financial inclusion
- Enhance productivity reducing logistical costs
- Dedicated Freight Corridor (DFC) project
- Last mile connectivity
- PM Gram Sadak Yojna (PMGSY)
- Deendayal Upadhyaya Gram Jyoti Yojana (DUGJY)
- Reduce regional disparities
- Aspirational Blocks program
- Agricultural development
- Digital Public Infrastructure for agriculture
- Women empowerment
- Stimulates economic growth by increasing connectivity and attracting investments
- Types
- Economic - TEC-CDS
- Energy
- Transportation
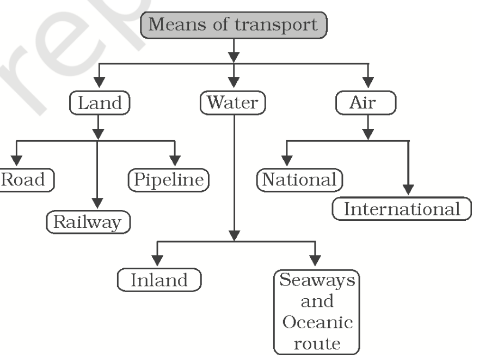
- Waterways - only 1% to the country’s transportation, for china it is 8.7% - World bank
- Economic - TEC-CDS
Comparative advantage
Inland waterways : 30 paisa / km ; rail : 1rs/km ; roads 1.5rs/km
CAR-D (Cargo Data) Portal
PANI (Portal for Asset and navigation Information)
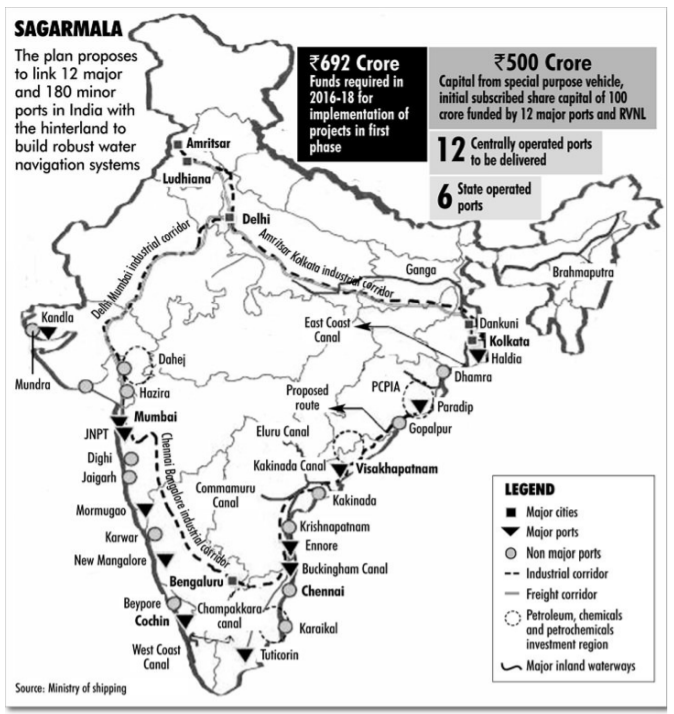
Sagarmala
-
- Communication
-
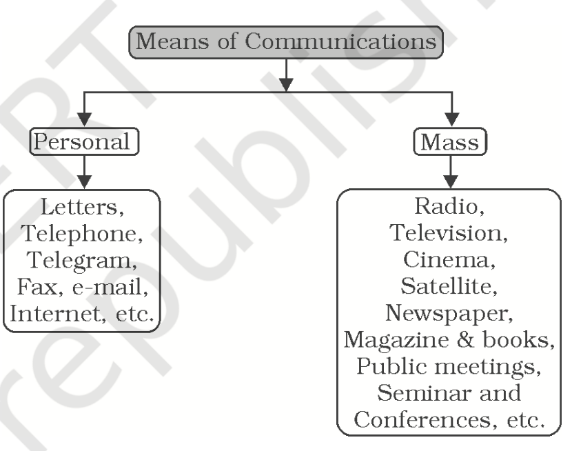 - Credit and monetary system
- Digital connectivity
- Power supply
- Credit and monetary system
- Digital connectivity
- Power supply
- Social
- Health
- Education
- Sanitation
- Housing
- Social
- Communication
-
- Measures
- Innovative Financing Mechanisms
- Example: InvITs, REIT, Sovereign Green Bonds
- Deepak Parekh committee on Infrastructure financing
- Streamlined Regulation
- Example: Single-window clearance systems
- Efficient Project Management
- Example: project monitoring tools like GIS for real-time tracking.
- Public-private partnerships
- Example: Viability Gap Funding (VGF) schemes
- Technological Upgradation
- Example: Implementation of smart metering systems
- Incorporate sustainable practices
- Example: Green building standards like GRIHA and LEED Ratings
- Workforce planning for large-scale renewables deployment
- Increase R&D
- Innovative Financing Mechanisms
- Government initiatives
- National Infrastructure Pipeline
- PM Gati Shakti National Master Plan
- Dedicated freight corridors
- National Logistics Policy
- Conclusion
- Focus on 3G - Green technology, green infrastructure, green funding (FIT)
Energy
- The energy sector in India encompasses electricity generation, transmission, distribution.
- Energy security is defined as the uninterrupted availability of energy sources at an affordable price.
- World Energy Outlook 2023 - Fossil fuel share in the global energy supply is projected to reduce from around
80% to 73% by 2030.
- Renewables are set to contribute 80% of new power capacity by 2030.
- Key Components of the Energy Sector:
- Electricity Generation: Includes thermal, hydro, nuclear, and renewable energy sources.
- Transmission and Distribution from power plants to consumers
- Sources of energy
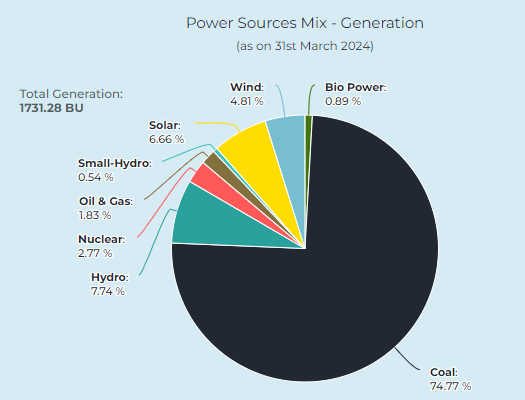
- Commercial - coal, petroleum
- Non commercial - firewood, agricultural waste
- Non conventional
- Hydel (11.3%)
- RES (30.1%)
- Solar
- Wind
- Geothermal
- Tidal
- Fuel cells
- Nuclear (1.6%)
- Total installed capacity - 417 GW
- Fossil Fuel based - 237 GW
- RES - 173 GW
- Nuclear - 6.7 GW
- The rise in 1.6B - CARE ratings.
- India : 4th in wind power, 4th in solar power and 3rd in renewable power installed capacity
- EV can cut India’s energy demands by 64% and carbon emissions by 37% by 2030.
- 1947 - 1362 MW, 2023 - 416 GW
- The total installed renewable energy capacity is 178.98 GW in October 2023
- Target - 500 GW by 2030
- Targeting addition of 50GW per annum
- Challenges in the Energy Sector:
- Dependence on Fossil Fuels :
- Example: 75% of electricity is generated from coal-fired power plants.
- Transmission and Distribution Losses
- Example: Aggregate technical and commercial (AT&C) losses were around 21% in 2022-23
- Financial Health of DISCOMs: Distribution companies (DISCOMs) face financial distress
- Example: Total debt of DISCOMs stood at over Rs 6.61 lakh crore, 2.4% of the national GDP
- Investments and financing issues in infrastructure development
- Regulatory and Policy Issues:
- Example: Delays in land acquisition and clearances for new projects.
- Environmental Impact
- Example: India is the third-largest emitter of greenhouse gases globally.
- Dependence on Fossil Fuels :
- Challenges faced by renewable energy sector
- Land availability
- High initial capital investment
- Issues related to energy storage and integration of renewables into the grid.
- Intermittency
- Threat to biodiversity - GIB in Rajasthan
- Shortage of skilled manpower for the installation and maintenance of renewable energy systems.
- Financing challenges, Grid integration issues, Land acquisition challenges, Import dependencies
- Key Strategies for Achieving Energy Transition
- Expand Renewable Energy Deployment
- Solar, wind, biogas, etc
- Invest in Energy Efficiency Measures
- buildings, industries, and transportation systems
- Innovation in battery storage and grid management to improve the reliability of renewable energy sources.
- Advance Energy Storage Technologies
- Private Sector Participation
- Tata Power and Adani Green Energy
- Promote International Collaboration
- Encourage Consumer Adoption
- subsidies, incentives, and educational campaign
- Expand Renewable Energy Deployment
- Why renewable going to rise?
- Ambitious government policies and initiatives
- Falling renewable energy costs
- Favorable investment climate for renewables
- Growing consensus on phasing out fossil fuels
- Rising public awareness
- Increase in energy storage and grid management systems
- Increase renewable energy adoption
- Solar energy
- Introduction
- As a sunshine country lying in the tropical belt, India has natural advantage to harness solar energy for green energy transition.
- Installed solar energy capacity - 84.27 GW
- Introduction
- Benefits of solar energy
- Renewable : solar energy is abundant and inexhaustible
- Clean energy : no direct greenhouse gas emissions
- Less Air and Water Pollution
- Sustainable : reduced import dependency
- Cost-Effective in the Long Run
- Job Creation and Economic Growth
- Off-Grid Applications : used in remote areas without access to the power grid
- Investment in training program
- Suryamitra program
- Challenges associated with energy generation
- High Initial Costs
- Luminescent solar concentrators
- Land Requirement
- Import dependencies
- Photovoltaic cells (Import dependency)
- Lithium batteries
- India imported $1 B worth of lithium ion cells in 2022
- Intermittent availability
- Technical and logistical challenges in grid management and energy storage systems
- Low energy density
- Maintenance and servicing
- High Initial Costs
- Government initiative
- National Solar Mission (280 GW by 2030)
- Solar Park Scheme
- Bhadla solar park, Rajasthan
- Atal Jyoti Yojna - Solar street lights
- PM-KUSUM - solar pumps
- Solar Rooftop Program
- SRISTI Scheme
- M-SIPS (modified special incentive package scheme)
- Net Metering & Renewable Purchase obligation policy
- Green bonds
- Production-Linked Incentive (PLI) Scheme for PV Modules
- Promote rooftop solar and floating solar projects
- PM Surya Ghar: Muft Bijli Yojana
- Installation of 30 GW of solar capacity through residential rooftop solar system (RTS).
- Cost 75000 crores
- 1 crore+ registrations
- Subsidy structure
- PM Surya Ghar: Muft Bijli Yojana
30,000/kw up to 2 kw
18,000 for another kw up to 3 kw (i.e., max - 78,000)
- International cooperation
- India-middle east-Europe green hydrogen pipeline
- International solar alliance
- India and UK - ‘Green Grid Initiative’ - One Sun, One World, One Grid’
- First proposed by Prime Minister Narendra Modi in 2018 in ISA
- Purpose - *SPECIALTY
- India and UK - ‘Green Grid Initiative’ - One Sun, One World, One Grid’
- Fuel cells are devices that convert chemical energy directly into electrical energy through an electrochemical process.
- Types of fuel cells:
- Proton exchange membrane fuel cells (PEMFCs)
- Solid oxide fuel cells (SOFCs)
- Molten carbonate fuel cells (MCFCs)
- Wind energy
- Issues
- Land availability and acquisition for large tracts of wind farms in challenging
- Wind Availability in region
- Insufficient transmission grid infrastructure and connectivity to national grid
- Intermittency of power generation - due to seasonal and diurnal variations
- Loss of Biodiversity : birds and bats
- High Initial Costs:
- Ensuring the efficiency and maintenance of wind turbines
- Recommendations
- Grid modernization and develop smart grid solutions : reducing peak loads, improving security
- Encouraging long-term investment through green bonds
- Provide financial incentives, subsidies, and low-interest loan
- National Wind-Solar Hybrid Policy
- Green Energy Corridor
- Issues
- Green Hydrogen
- Introduction
- Green hydrogen refers to hydrogen produced using renewable energy sources, such as solar or wind power, through a process called electrolysis.
- The International Renewable Energy Agency (IRENA) estimates hydrogen and its derivatives will account for 12 percent of global final energy consumption by 2050.
- Introduction
- Purpose
- Energy security
- Decarbonize various sectors, including transportation, industry, and power generation.
- Benefits
- Clean energy - Net zero transition by 2070
- Energy storage - ensuring reliable and stable energy supply
- Decarbonization of Hard-to-Abate Sectors:
- transportation (fuel cell vehicles),
- industrial processes (e.g., ammonia production),
- power generation (fuel cells)
- Versatile : used in multiple forms: as a fuel, raw material, heating.
- Challenges
- Low Energy Efficiency
- Safety issues - highly volatile, flammable
- Expensive to produce
- Infrastructure - Storage, transmission and supply network
- Alternative Technologies: practical and cost-effective
- Water intensive production (wastage of high amount of water)
- Electrolysers Import dependency
- Government Initiative
- National Green Hydrogen Mission - Global hub of production
- PLI for Electrolysers
- Strategic Interventions for Green Hydrogen Transition Programme (SIGHT) - domestic electrolysers capacity building
- Rs 17,490 crore
- Green hydrogen hub
- National Green Hydrogen Mission (NGHM)
- Achieve a green hydrogen production capacity of 5 MMT per year by 2030
- Research and Development Funding
- Policy Support - Green Hydrogen policy
- Public-Private Partnerships
- National Green Hydrogen Mission - Global hub of production
- International cooperation
- Global Programme for Hydrogen in Industry (UNIDO)
- Accelerating Clean Hydrogen Initiative (WEF)
- Conclusion
- Renewable energy capacity addition of about 125 GW (giga watt) by 2030 from green hydrogen is essential for meeting the Panchamrit pledge of 50% by 2030.
- Nuclear Energy
- Long term Low Emission Development Strategy (LT-LEDS) - three-fold rise in nuclear installed capacity by 2032
- Current installed capacity - 7,380 MW; target - 22,480 MW by 2032 - 100 GW by 2047
- Total reactors - 23 operable; 7 in operation
- Advantages - clean, reliable, affordable
- Energy
- Energy production with small amount of fuel due to much higher energy density
- Uranium pallet could contain as much as 1 ton of coal
- Stable and reliable source
- continuous and stable base load power for grid stability
- Energy production with small amount of fuel due to much higher energy density
- Energy security : with technological advancements in fast breeder reactors and thorium-based reactor
- Strengthens India’s strategic autonomy by reducing dependence on energy imports
- Economic
- Not subject to price fluctuations in the international market.
- Reduce import dependency
- Industrial growth
- Low operational cost
- Employment generation
- Environmental
- Low carbon emissions: only about 5-6 gm/kw-h
- Social -
- Health application of nuclear radiation
- Geographical
- Less area needed
- Mini nuclear plants -> remote electrification in Ladakh, North east
- E.g. small nuclear modular reactors
- Energy
- Issues
- High gestation period
- High cost of reactors, operation and maintenance
- Dependance on nuclear fuel and technology
- Environmental impact like thermal pollution due to water discharge
- Fears
- Accidental leakages
- Chernobyl(1986)
- Fukushima(2011)
- Radioactive waste disposal is a challenge which remains hazardous for 1000s of years
- Sabotage : Security issues of nuclear power plants amidst
- Terror attack
- War (R-U Zaporizhzhia)
- Nuclear proliferation
- Public perception
- Protests against the Kudankulam Nuclear Power Plant
- Accidental leakages
- Small Modular Reactor
- Smaller, modular, and transportable reactor
- Power Output: Typically 10 MW to 300 MW per unit
- Purpose: Used for electricity generation, hydrogen production, desalination, and industrial heat applications.
- Schemes
- Bharat Small Reactors (BSRs): 220 MWe Pressurized Heavy Water Reactors (PHWRs).
- ₹20,000 crore to establish a Nuclear Energy Mission
- Potential legislative reforms.
- Faster adoption and manufacturing of electric and hybrid vehicles (FAME) India Scheme
- Electric Mobility Promotion Scheme (EMPS)
- electric two-wheeler (e2W) and three-wheeler (e-3W)
- National Biofuels Policy
- Ethanol blending 20% for petrol and 5% in diesel by 2025
- Pradhan Mantri JI-VAN Yojana
- for providing financial support for setting up second-generation (2G) ethanol projects
- GOBAR (Galvanizing Organic Bio-Agro Resources) DHAN Scheme
- Global Biofuel Alliance under India’s G20 presidency
- SATAT (Sustainable Alternative Towards Affordable Transportation) scheme on Compressed Biogas (CBG)
- Hydro power
- Hydropower account for 13% power generated in india.
- Underexploited potential of hydro electricity (15%) <> US(90%)
- Likely to increase amid global warming
- Two types of system
- Storage system
- Run of the river system
- Small hydro power - installed capacity < 25MW
- Current capacity - less then 3726 MW
- Potential - 19750 MW, over 5500 sites are identified
- Government initiatives
- PM Ujawala Yojna - 11 Crore LPG
- Rural electrification
- Deen Dayal Upadhyay Gram Jyoti Yojna
- Increased energy access
- SAUBHAGYA - PM Sahaj Bijli har Ghar Bijli Yojna
- 11 crore rural household electrified
- SAUBHAGYA - PM Sahaj Bijli har Ghar Bijli Yojna
- Ethanol blending
- Target of 20% blending by 2025
- National Mission for Enhanced Energy Efficiency (NMEEE)
- Generation Based Incentive (GBI) schemes
- Renewable purchase obligations
- Renewable energy R&D programme
- Galvanizing Organic Bio-Agro Resources Dhan (GOBARdhan)
- Pradhan Mantri JI-VAN (Jaiv Indhan- Vatavaran Anukool fasal awashesh Nivaran) Yojana - bio-ethanol project
- Measures
- Recommendations for Energy Sector
- Diversification of Energy Sources
- Example: PM Surya Ghar : Muft Bijli Yojna
- Enhancing Grid Infrastructure:
- Example: Implementation of smart grids and advanced metering infrastructure (AMI)
- Financial Reforms for DISCOMs
- Example: The Ujjwala DISCOM Assurance Yojana (UDAY) scheme
- Attracting Investment
- Sovereign Green Bonds
- Policy and Regulatory Stability:
- Example: Establishing single-window clearance
- Improving reliable and affordable energy access for all
- Example: The Saubhagya scheme
- Promoting Energy Efficiency
- The National Mission for Enhanced Energy Efficiency (NMEEE)
- Diversification of Energy Sources
- Progress made by India
- Affordable energy
- Ujjwala Yojana : over 11 crore LPG connections have been provided
- Saubhagya Scheme : More than 11 crore households were electrified
- Surya Har Ghar : Muft Bijli Yojna - 75000 crore budget outlay; already 3 crore registration received
- Reliable Energy
- Significant investments in expansion of national grid
- Smart Metering : Installation of 1 crore smart meters under Smart Meter National Programme (SMNP)
- Sustainable Energy
- Renewable Energy Expansion : aiming for 500 GW by 2030
- National Solar Mission
- National Hydrogen Mission
- Modern Energy
- Electric Mobility : FAME-II scheme with outlay of ₹10,000 crore
- Energy Efficiency Programs under NMEEE
- Affordable energy
- Conclusion
- SDG 7
- pledge or Panchamrit (Glasgow 2021)
Ports
- Key Components of the Port Sector:
- Major Ports: Governed by the central government
- Minor Ports: Managed by state governments or private entities
- Cargo Handling: Includes bulk cargo (coal, iron ore), liquid cargo (crude oil, chemicals), and container cargo.
- Container Terminals: Specialized facilities for handling containerized cargo.
- Port Connectivity: Ensures seamless movement of goods to and from ports via road, rail, and inland waterways.
- Challenges in the Port Sector:
- Capacity Constraints : inadequate to handle growing cargo volumes.
- Example: Many ports operate at near-full capacity, leading to congestion and delays.
- Operational inefficiencies and bureaucratic delays
- Poor Connectivity: Inadequate hinterland connectivity
- Technological lag in adapting modern technologies
- Example: Limited use of automated cargo handling systems
- Complex regulatory frameworks and policies
- Example: Multiple clearances and approvals required
- Insufficient funding and investment in port infrastructure
- Capacity Constraints : inadequate to handle growing cargo volumes.
- Recommendations
- Capacity Expansion
- Operational Efficiency:
- Example: Use of automated cranes, RFID tracking, and digital logistics platforms.
- Enhanced Connectivity
- Example: The Dedicated Freight Corridor (DFC) project
- Technological Upgradation : leverage blockchain, IoT, AI
- Example: Implementing Port Community Systems (PCS) for seamless information exchange.
- Regulatory Reforms
- Example: Single-window clearance systems
- Public-Private Partnerships (PPP):
- Example: Successful PPP projects like Mundra Port demonstrate the benefit
- Major Ports
- Kandla Port - Gulf of Kachchh - Petroleum
- Mumbai Port
- Jawaharlal Nehru Port at Nhava Sheva (To reduce load at Mumbai Port)
- Marmagao Port - Goa - Iron-ore exports to Japan
- New Mangalore Port
- Kochchi Port (Natural harbour)
- Haldia Port
Roads
- The road sector in India is the backbone of the country’s transportation network, essential for the movement of goods and people, and pivotal for economic growth.
- Handles about 85 per cent of passenger and 70 per cent of Freight.
- 1947 - 0.399 million km, 2023 - 4.70 million km
- India has the second largest road network in the world
- Hybrid vehicles are better medium term solutions for decarbonization as compared to EV.
- Key Components of the Road Sector:
- National Highway - 2% Length, 40% Traffic.
- State Highways - 4%
- District Roads - 14%
- Rural Roads - 80%
- Expressways
- Challenges in the Road Sector:
- Inadequate Infrastructure: poor quality and insufficient capacity leading to congestion and delays
- Lack of regular maintenance results in deteriorating road
- Example: Potholes and road damage during monsoons
- Safety Concerns: High accident rates and fatalities due to poor road conditions, inadequate signage, and enforcement.
- Financial and investment constraints
- Land Acquisition:
- Environmental Impact: Road construction can lead to deforestation, habitat fragmentation
- Urban-Rural Disparities : in road infrastructure quality
- Technological Lag : limited use of green materials like Fly ash
- Electric vehicles
- An electric vehicle (EV) is a vehicle that propels itself using electric motors powered by energy stored in onboard batteries.
- Reduced Carbon Emissions
- Zero tailpipe emission
- Lower lifecycle emission due to electricity generation from cleaner sources
- Higher Efficiency : 85-90% compared to 20-30% for ICE vehicles.
- Lower Maintenance Emission : from production and disposal of spare parts
- Key benefits
- More energy efficient compared to traditional vehicles
- Less maintenance
- Better performance
- Air quality improvement in urban areas
- Quieter operation
- Better technology
- Government Incentives
- Increasing resale value
- Government initiatives
- Faster Adoption and Manufacturing of Hybrid & Electric Vehicles (FAME)
- PM E-DRIVE
- Issues
- Road safety
- Government initiatives
- Atal Mission for Rejuvenation and Urban Transformation (AMRUT)
- National Road Safety Policy
- PRADHAN MANTRI GRAM SADAK YOJANA (PMGSY)
- Bharatmala Pariyojana
Railways
- Introduction
- India has 4th largest railway network in the world. More than 2 crore people travel in rail every day. More than 1 billion tonnage in a year.
- 16 zones
- Broad gauge - 1.676 m
- Metre gauge
- Narrow gauge - 0.762 metre or 0.610 (hilly areas)
- Key Components of the Railways Sector:
- Passenger Services
- Example: The introduction of Vande Bharat Express trains
- Freight Services:
- Railway Infrastructure: Includes tracks, stations, signalling systems, and maintenance facilities.
- Suburban Rail Networks : Essential for urban commuters
- Example: The Mumbai Suburban Railway network
- High-Speed Rail:
- Example: The Mumbai-Ahmedabad High-Speed Rail Corridor (bullet train project)
- Passenger Services
- Challenges in the Railways Sector:
- Aging Infrastructure: outdated rail infrastructure leading to inefficiencies and safety concerns.
- Financial Constraints : high operating costs and inadequate revenue.
- Capacity Constraints: Overcrowding in passenger trains and congestion on freight corridors
- Safety Issues: Accidents due to derailments, collisions, and unmanned level crossings pose significant risks.
- Slow adoption of modern technologies
- Example: Limited implementation of advanced signalling systems and automated train controls.
- Service Quality: Issues related to punctuality, cleanliness, and passenger amenities affect service quality.
- Inefficient management and operational practices
- Example: High employee-to-km ratios and low productivity levels
- Recommendations
- Infrastructure Modernization: Upgrade tracks, stations, and signalling systems
- Example: Dedicated Freight Corridors (DFC)
- Financial Reforms : dynamic pricing and cost-cutting initiatives.
- Example: Introducing private operators in passenger services to increase revenue and efficiency
- Capacity Enhancement: Expand rail network capacity through double-tracking and high-speed trains
- Safety Improvement
- Example: Implementation of the Train Collision Avoidance System (TCAS) - KAVACH
- Technological Upgradation
- Example: Implementing European Train Control System (ETCS) for better signalling and train control.
- Enhancing Service Quality: Improve passenger amenities, cleanliness, and on-time performance.
- Example: Introduction of bio-toilets, improved catering services, and better station facilities.
- Streamline operations and management practices
- Example: Adopting lean management practices and increasing the use of IT solutions
- Infrastructure Modernization: Upgrade tracks, stations, and signalling systems
- Rail Accidents
- Reasons
- Derailments - According to CAG, 69% of railway accidents in FY18- FY21, were because of derailments.
- 36% accident - unmanned level crossings gates.
- Congestion of tracks : capacity utilization exceeds 125%
- Lack of anti-collision technologies
- E.g. Balasore train accident
- Speeding and skipping red signal
- nearly 25% of the total railway track in India is over age
- Way forward
- Rashtriya Rail Sanrakshan Kosh
- Constitution of Railway Safety Authority
- Example
- Reasons
- Government initiative
- National Rail Plan
- Freight traffic from current 27% to 45% by 2030
- Construction of Dedicated Freight Corridors (DFCs)
- Traffic collision avoidance system (TCAS)
- KAVACH
- National Rail Plan
- BIBEK DEBROY committee -
- Railway regulatory authority
- Private participation
- Indian Railways Manufacturing Company (separate entity)
- Railways Safety
- KAKODKAR committee such as an advanced signalling system
- Operational measures
- Kavach
- Fire Extinguishers
- Track Recording Car
- Bridge Management System (BMS)
- Administrative
- Railway Protection Force (RPF)
- Railway Protection Force (RPF)
Airports
- India third largest aviation market with air traffic growing at least 16% per year
- UDE DESH KA AAM NAAGRIK (UDAN) Scheme
- National Civil Aviation Policy (NCAP) 2016
- Key Components of the Airports Sector:
- Major International Airports
- Regional Airports
- Greenfield Airports
- Airport Infrastructure: Includes runways, terminals, air traffic control (ATC) systems, and ground services.
- Cargo Handling Facilities: Infrastructure for handling and processing air cargo efficiently.
- Challenges in the Airports Sector:
- Capacity Constraints : operate at or beyond capacity
- Financial Viability
- Example: Many regional airports struggle to generate sufficient revenue to cover operational costs.
- Slow adoption of advanced technologies
- Example: Limited implementation of automated check-in and baggage handling systems.
- Environmental Impact : contribute to noise, air pollution, and habitat disruption.
- Service Quality : like cleanliness, accessibility, and customer service.
- Example: Passenger complaints about long wait times
- Infrastructure Deficits :
- Regulatory Hurdles
- Example: Delays in environmental clearances and land acquisition for airport projects.
- Recommendations for Improvement:
- Capacity Expansion
- construction of greenfield airports
- Modernization of Facilities: Upgrade terminals, runways, and other facilities
- Financial Models
- (PPPs) to enhance investment
- Technological Advancements:
- Example: Implementation of biometric boarding systems and advanced ATC technologies.
- Environmental Sustainability
- Example: Using solar power for airport operations and implementing green building standards.
- Enhanced Safety and Security
- Biometric verification, increasing security personnel
- Capacity Expansion
Investment Models
- Introduction
- Investment - an act or undertaking with the expectation of a worthwhile result.
- Need for Investment
- Sources of Investment
- Types of Investment Models
- Domestic Investment Models
- Public Investment Model : Government funds projects directly
- Example: Pradhan Mantri Gram Sadak Yojana (PMGSY)
- Public Investment Model : Government funds projects directly
- Domestic Investment Models
- Private Investment Model
- Equity Financing: Private companies raise capital by issuing shares to investors.
- Venture Capital and Private Equity: Investments in startups and private firms
- Corporate Bonds: Corporations issue bonds to fund expansion and projects
- Foreign Portfolio Investment (FPI)
- Real Estate Investment Trusts (REITs)
- Angel Investors and Incubator
- Foreign Investment Models:
- FDI
- FII, etc
- Sector Specific Investment Models
- Public Sector Undertakings (PSUs)
- Example: ONGC’s investments in the energy sector.
- Public Sector Undertakings (PSUs)
- Cluster Based Investment Models
- Special Purpose Vehicles (SPVs): Government forms entities to execute specific projects.
- Example: Delhi Metro Rail Corporation (DMRC) for urban transportation.
- PPP in Railways
- Modernization of Infrastructure
- Rani Kamlapati RS in Bhopal
- Improved Passenger Amenities
- clean and spacious waiting areas, better sanitation, and improved accessibility.
- professional management practices ensuring high standards of cleanliness and service.
- PPPs help in generating non-fare revenue through commercial development of station premises.
- Retail spaces, restaurants, and office complexes
- Costs sharing of redevelopment
- Focus on passenger comfort and convenience leads to a better travel experience.
- Modernization of Infrastructure
- Investment Models Followed by India
- Public Private Participation Investment Model (PPP)
- Public-Private Partnership (PPP) is a collaborative investment model between government and private entities to finance, build, and operate projects.
- PPPs aim to leverage private sector efficiency and public sector oversight.
- Type of PPP Models
- Build-Operate-Transfer (BOT): Private sector builds the infrastructure, operates it for a specified period, and then transfers it to the government.
- Example: National Highways developed under the BOT model.
- Design-Build-Finance-Operate (DBFO): Private entity designs, builds, finances, and operates the project, often involving complex projects.
- Example: Mumbai Metro Line 1.
- Lease-Develop-Operate (LDO): Government leases an existing facility to a private entity, which upgrades and operates it.
- Build-Own-Operate-Transfer (BOOT): Private sector builds, owns, operates, and then transfers the project after a set period.
- EPC (Engineering, Procurement and Construction) - 100% government finance
- PPP Annuity
- PPP Toll
- BOO (Build–Own–Operate)
- BOT Annuity
- private entity receives fixed payments (annuities) from the government instead of tolls collected from users
- DBFOT -(Design-Build-Operate-Transfer)
- HAM (Hybrid Annuity Model) -
- EPC + BOT-Annuity
- Payment structure
- (40% payment- during construction) + (60% payment as annuity after construction).
- Risk sharing
- Construction Risk: pvt + govt
- Revenue Risk : govt
- Highways
- Operate Maintain Transfer (OMT)
- Toll Operate Transfer (TOT)
- Airports
- Operations, Maintenance & Development (OMD)
- Build-Operate-Transfer (BOT): Private sector builds the infrastructure, operates it for a specified period, and then transfers it to the government.
- Factors to consider while designing an concessional agreement
- Objectives, scope, and deliverables of the project, timeline for completion
- Financial arrangements: Investment costs, revenue-sharing mechanisms, pricing mechanisms
- Performance Standards about service quality, maintenance, and safety and it’s monitoring mechanisms
- Termination Clauses
- Tariff and Pricing Mechanisms : protect consumers and ensure reasonable returns for private investors
- Dispute resolution mechanism
- Risk allocation like construction delays, cost overruns, and demand fluctuations
- Example: PPP model in highways often allocates demand risk to the private party.
- Performance standard
- Monitoring mechanism
- Role in Development | Advantages
- mobilization of private sector capital reduce fiscal burden on government
- private sector brings in efficiency, technical expertise, and innovation in project execution and management.
- Risk sharing : like cost overruns and delays in construction, operation, and maintenance
- Faster and timely project completion due to private sector efficiency in project execution
- improved quality due to performance-based contracts
- Clearly defined contracts and performance metrics enhance accountability and transparency
- Challenges
- Long gestation period (15-30 yrs.) - transfer unsuitable labilities to the future
- Complex project structuring : time-consuming process, legal, financial, and technical considerations.
- Political and policy risks : shifts in policy direction can disrupt the long term viability
- Securing long-term financing
- Transparency, fairness, and accountability
- Enforcing and monitoring the contract
- Measures
- Vijay Kelkar committee
- Establishment of independent regulatory agency
- Zero coupon bonds
- Infrastructure PPP Adjudication Tribunal (IPAT)
- PPP Project Review Committee (IPRC)
- Vijay Kelkar committee
- Long-term planning and risk assessment
- Clearly outline the responsibilities and obligations throughout project lifecycle
- Long-term sustainability consideration -
- environmental, social, and economic sustainability.
- Risk management frameworks
- Energy efficiency, resource conservation, social inclusiveness, and resilience to climate change impacts.
- Robust governance and oversight
- Formulation of PPP laws
- Viability gap funding
- Swiss challenge method
- Conclusion
- PPP can change our infrastructure model from Build-Neglect-Rebuild to Build-Nurture-Repair (Rakesh Mohan Committee)
- Overall, PPPs can be a valuable tool for modernizing India’s infrastructure. Vijay Kelkar committee recommendations should be considered for reaping full benefits of this model.
- PPP can change our infrastructure model from Build-Neglect-Rebuild to Build-Nurture-Repair (Rakesh Mohan Committee)